
What Is Space Utilization? How to Measure It and What the Numbers Mean
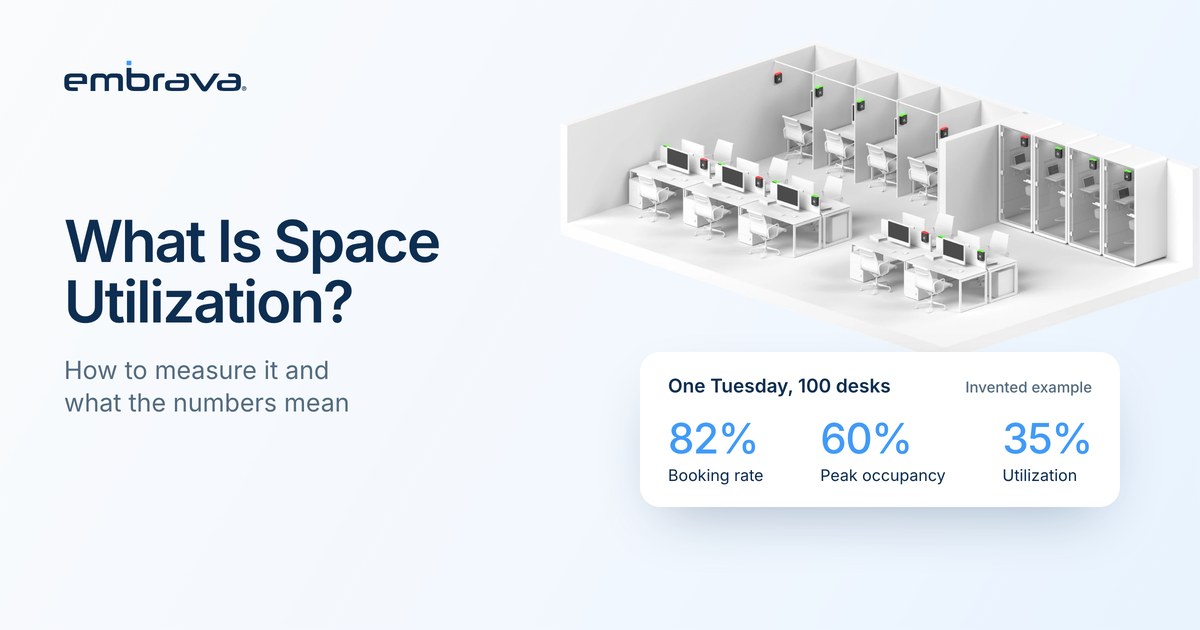
Space utilization is the share of available space that people use, measured over a defined period. For desks, it is occupied desk hours divided by available desk hours. It differs from booking rate, which counts reservations, and from peak occupancy, which counts the busiest moment. Reports mix the three, so the first step in any comparison is to ask which one a number describes.
Illustrative scenario. The numbers below are invented to show the arithmetic. They are not benchmarks and do not describe an Embrava customer.
Friday, 4:30 p.m., a spreadsheet and three answers
A facilities lead has been asked one question: how full is the office? She has three sources. The booking system says 82 of 100 desks were reserved on Tuesday. The badge system says 64 people came into the building. Walking the floor at 11:00, she counted 58 desks occupied.
All three are correct. They answer different questions. The reservation count shows plans, the badge count shows people at the door, and only the walk shows desks in use. Nobody had agreed which one the answer should come from.
What is space utilization?
Space utilization describes how much of a space is used. Three measures are in common use, and they are easy to confuse:
- Utilization. Occupied hours divided by available hours, over a stated period. It averages the day.
- Peak occupancy. The most desks or rooms in use at the same moment, divided by what is available. It describes the busiest point.
- Booking rate. Reservations divided by available desks or rooms. It describes intent, not presence.
For the same desks and hours, average daily peak is never lower than utilization. Report the name of the measure every time, and fix two things before you compare any numbers: the capacity (desks, seats, bookable desks or assigned people) and the period (which days, which hours, how many weeks).
| Measure | How it is counted | Result |
|---|---|---|
| Booking rate | Desks reserved divided by 100 | 82% |
| Peak occupancy | Most desks occupied at one moment, divided by 100 | 60% |
| Utilization | Occupied desk hours divided by 1,000 available desk hours | 35% |
Where do the common numbers come from?
Published figures describe portfolios, not your floor, and their methods differ. CBRE's 2026 benchmarking reports a global average building utilization rate of 53%, labeled as the average for respondents, based on data from CBRE clients representing 303 million square feet. CBRE does not say in that article whether the 53% is hours-based or peak-based. JLL's Global Occupancy Planning Benchmark Report 2026 reports global office utilization of 56%, from a survey of 84 organizations, and does not define how that figure is calculated. JLL says its report is not intended to serve as a space utilization calculator because metrics and calculations vary greatly.
Treat the 53% and the 56% as two separate reference points, not a like-for-like comparison, and do not compare either with an hours-based figure from your own floor unless you know how it was measured.
Use them as context. Set your own target from your own peaks, space types and sharing ratio. JLL reports that the gap between actual and target utilization narrowed from 25 to 18 percentage points in 2026, helped by a 5 point cut in targets. Targets move.
How do you measure it?
JLL reports that badge swipe data (92%) is the most common measurement method and that averaging daily peaks (69%) is again the most popular way to calculate utilization. On page 17, JLL notes that building badge data can tell you how many people came in but not which seats they used. Space-level measurement needs reservation system data, sensors or video analytics calibrated to individual rooms and workstations.
Each source answers part of the question:
- Reservation data shows what people planned.
- Check-in data shows who arrived at a desk or room, where check-in is in use.
- Sensors or cameras show presence, if you deploy them.
- Walk-throughs give a manual check that costs little and tests the rest.
Measure several full weeks, report by weekday, and keep the denominator the same each period. Dividing by desks, seats or assigned people gives three different answers.
What do utilization numbers not tell you?
They do not describe how well a space works for the people in it. Gensler's 2026 Global Workplace Survey, an anonymous panel survey of 16,459 full time office workers in 16 countries fielded between July 22 and September 12, 2025, found that two thirds report "hacking" their workspace to compensate for gaps in how it performs. None of that appears in a utilization report. Put employee experience data beside the numbers.
Where does Embrava fit?
Embrava connects the booking systems you already use with the places where people need the answer. Desk Sign shows desk status at the desk. Room Sign shows room status at the door. Where check-in is switched on in the booking platform, an arrival signal becomes available at the desk or room. A check-in is not a measurement of occupancy, and a status display does not replace a utilization study. For a worked method and the latest benchmark table, read Desk Utilization Benchmarks 2026. For the gap between booked and used desks, read Why Do Booked Desks Sit Empty?.
Frequently asked questions
Talk with an expert
Bring one week of booking data and the platform you use, and we can walk through which measure answers your question and what a status display would add. Talk with an expert.
Related reading
- Desk Utilization Benchmarks 2026
- Why Do Booked Desks Sit Empty? How to Diagnose and Fix It
- Hot Desk Booking: How to Set It Up So People Can Find a Desk
Sources
- CBRE, The Hybrid Reality: Why the Office Is More Important Than Ever, 2026 Global Workplace and Occupancy Insights, Part 1 (January 20, 2026)
- JLL, Global Occupancy Planning Benchmark Report 2026: Measuring What Matters (May 2026)
- Gensler Research Institute, Global Workplace Survey 2026
- Embrava, Desk Sign and Room Sign (live product pages)